Welcome
Welcome to the UAARG (University of Alberta Aerial Robotics Group) guide! This book holds onboarding documentation and tutorials for all of UAARG's subteams.
The book is viewable at uaarg.com/guide.
Subteams
Contributing to the Docs
See the guide repository to make changes to this guide.
Intro to the UAARG Airframe Subteam
Hello and welcome to the UAARG Airframe Subteam! This page it to serve as a guide for you to learn about who we are and what we do.
At UAARG Airframe, we do a lot of things, some of which include aero design, electromechanical design, and manufacturing. There are tons of things you can learn at your time with the UAARG Airframe team, but not all of them can encapsulated in a single guide so I will be primarily including resources to introduce you to the basics of what we do at UAARG Airframe.
Some things you should be familiar with
- SolidWorks (See this for a SolidWorks Guide)
- 3D Printing
- Basic Aerodynamics
- Basic Structural Analysis
- Common Hand Tools
Intro to SolidWorks
This is a quick reference guide to videos and other resources to allow you to learn about SolidWorks. If you do not have a SolidWorks license, feel free to contact one of the Airframe subteam leads and they will get you access to a SolidWorks License.
Video Series
Text Guide (From SolidWorks)
You don't have to go through the entirity of these guides, but these serve as good introductions to SolidWorks and CAD. These serve as good resources for you to learn how to use SolidWorks so that you can apply it for when you go and design parts and assemblies.
Electrical
Software
This section contains documentation and tutorials for those working with the UAARG code bases.
It is meant to be self-contained. It should link to or explain all concepts new members need to be productive on our codebases. Larger concepts like Python programming or CS theory are out of scope, but resources should still be linked where possible.
Start by setting up all required tools in the Getting Started chapter.
Getting Started
Required Tools
Text Editor
The most important part about working on codebases is actually writing the code. Some popular editors are:
There are many others, but these are very common so we will cover them in this part of the guide. If you have any questions about how to use your specific editor, feel free to drop questions in the MS Teams Channel.
VSCode
You can download vscode from their website. It should run on most major operating system.
VSCode will then need to be setup with extensions for
Python.
This can be done from vscode by pressing Ctrl+P (or Cmd+P on a mac), paste
in the command ext install ms-python.python and press Enter.
PyCharm
The community edition of PyCharm should be fine for all UAARG work. By default it should be ready to work with our repositories.
PyCharm can be downloaded from the Jetbrains website.
Github
We use git a lot (see more details below). One of the many components of git is a source code host. We use Github for this purpose.
It is important to note that git and github are different things. This is a common source of confusion. Some of the differences are detailed below in the "Git" section.
Create an Account
You will need to create a Github account in order to read and write to our common code repositories.
To create an account, visit github.com, click "Sign Up" and follow the instructions. If you find that you already have an account, make sure you can actually log into it.
You should now be able to log into github.com and should have a github username.
Get Repository Access
Once you have created a github account, please share your username with a team lead. They will add you to the UAARG github organization.
In the meantime, once you install git (instructions below), you should be able to view and download all public code from the UAARG organization.
When you are granted access to the github organization, you will be able to push branches/commits and create issues/prs on our repositories.
Git
We use git to manage all of our source code. It lets us:
- Track changes to the code over time
- Collaborate on the code base concurrently
- Compare versions of the software at different points in time
Using Git is absolutely necessary. It is also an industry standard tool. Most software organizations will use git or something like it.
Background
Git is always confusing because it's decentralized. It is very much like email. You may setup an email address through GMail, iCloud, outlook, or use one from the University of Alberta. These are called email providers. Git's equivalent would be source code hosting services. Some popular source code hosts are Github, Gitlab, sourcehut, Bitbucket, etc.
Then there are email clients. For email there is the Apple mail app, android mail app, outlook, and thunderbird. These connect to any email provider. This way everyone gets to choose their favourite email provider and email client, and then they will always be guaranteed to work together as it's all email. Git has many different clients, there is a command-line interface (CLI), there are many graphical applications and most IDEs/code-editors include a git client too.
UAARG has chosen Github as our source code host. You will just need to choose a git client. If you do not like your git client, you have the freedom of using a different one. You may even use multiple if it is easier.
Choosing and Installing a Git Client
If you are completely new to git and do not have any experience with the tool, I recommend a GUI interface like Github Desktop. You can always install other tools later. Github desktop also let's you avoid much of the complexity of authorization with github.com.
Most IDEs and some text editors will ship with a git client as well. These will work just fine as well.
Configuration
Every git client will need to be configured with three things:
- Your name
- Your email (this can be, ie. your @ualberta address)
- Your source code host authentication details
Github Desktop
Github desktop can be configured by following these docs under the section "Authenticating an account on Github".
VSCode
You will need to install first install git using this website. All of the options presented by the installer can be left to their default/recommended values.
Then sign into Github using the "Accounts" menu in the lower right of the editor.
PyCharm
Jetbrains (the creator of PyCharm) has a guide on setting up version control for github.
Git CLI
Github has a set of handy docs on setting up the git CLI for use with Github.
The first part (items 1 and 2 above) is detailed here.
Then the last part (authentication, item 3 above) is explained here.
You will have to choose between authenticating with either HTTPS or SSH. If you don't know much about either, or which one to choose, then use HTTPS.
When using HTTPS, you will need to then cache your credentials (otherwise you
will need to paste in a very long key every time you use your git client.) The
github cli is a good choice for
this. After it has been installed, run gh auth login and it will guide you
through the rest.
Using and Learning Git
Git is both powerful and very complex. Many people get tripped up on it. So don't feel bad if you mess up or need help. Remember, we can always help by dropping questions in the MS Teams.
Github has an excellent set of resources on getting started with git. Here are a few good articles:
We also have a (simple) git tutorial that may be useful if you are using the command line.
Python
Python can be downloaded from python.org. The latest version should be fine. Make sure it's at least version 3.10.
NOTE: PyCharm users should already have python installed as part of the IDE. You should be able to skip this section.
If you are a MacOS or other UNIX-like OS user, python can also be downloaded from your package manager (brew/apt/pacman/pkg/etc...). If you are using these tools, I will assume that you know how to install python >= 3.10 :)
Installation
If you downloaded python from python.org, running the installer should be enough. You can leave every option on the default or recommended setting.
Usage
Terminal
Often our documentation asks that you run commands in a terminal. If you have no experience using the terminal, then feel free to avoid it. Where you cannot avoid it's usage, opening a terminal in your editor (vscode / pycharm)
The documentation should share what commands to run. Generally these will be:
python3(or justpythonon windows) -- Run the python interpreterpython3 -m venv-- Used to setup a virtual environmentls(ordiron windows) -- Show files in the current directorymkdir-- Create a folder/directorycd-- Move into a folder/directorycd ..-- Move up a folder/directory (in other words, move out of the current folder/directory)
Language
It would be helpful to have some python (or at least general programming experience). But newcomers are always accepted.
Python maintains this list of resources for learning Python.
You should also be learning python in almost any programming course at the University of Alberta. Profs and TAs are great resources. UAARG members are also here to help :)
Python is a large language, you don't need to be an expert here. Questions are always encouraged!
Troubleshooting
If you run into any issues, we can help. Feel free to drop a message in the MS Teams chat. Often when issues arise, they indicate that we should to a better job here in these docs or in our codebases.
Workflows
Git Branching Model
We use a modified version of git flow.
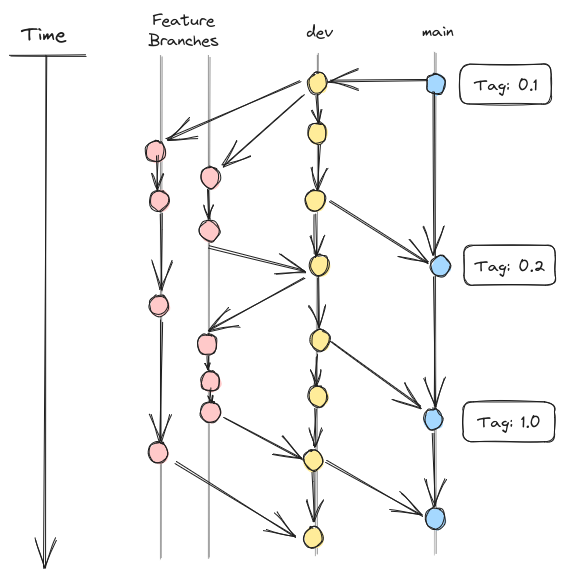
This means all development is separated into features. Each feature is a collection of related changes. For example, a feature may fix a single known bug or a feature may add a new screen to a GUI app.
Work on these features is structured as follows:
- The contributor (you) creates a branch and opens a "WIP" PR
- Contributor works on the feature (team leads and/or team members help where needed)
- Contributor asks for a review
- The team lead reviews the code
- If changes are needed, then we go back to (2)
- We merge the changes into
dev
Periodically, dev will be heavily tested. This will happen when one or more
new features have been merged into dev. If any issues are found, fixes are
merged. Finally, when dev is believed to be stable enough, it is merged into
main.
This process is in place to ensure that main always contains a stable copy of
the code. This is important for regular test flights which must only be done on
tested stable code.
Our Projects
Shepard
A collection of scripts running on the drone or for determining drone flight plans. These preform both imaging and autopilot tasks.
Repository: github.com/uaarg/shepard.
Getting Started
Shepard has a setup guide in it's README.
NOTE: Many of shepard's features are meant to be running on the onboard raspberry pi. The project should still be able to run on your machine, but it may have to stub out components such as the camera.
Important Technologies
Autopilot System
This page gives a high-level overview of how UAARG's autopilot system works and where its code lives. Only basic Python knowledge is assumed.
Overview
A Python script running on an onboard single-board computer (SBC), such as a Raspberry Pi, sends commands to the autopilot board (a Pixhawk). The Pixhawk executes those commands by signalling the ESCs (Electronic Speed Controllers), which in turn drive the motors.
Our work focuses on the Python side of this system. The Pixhawk firmware, ESCs and motors are third-party components and are not covered here.
Software Layers
From lowest to highest level:
| Layer | Description |
|---|---|
| MAVLink | The messaging protocol used to communicate with the Pixhawk. A MAVLink connection runs over TCP or UDP and behaves much like a standard network connection. |
| PyMAVLink | A Python library for opening a MAVLink connection and sending and receiving messages. |
| mavctl-python | Our in-house library built on PyMAVLink. It manages connections and hides PyMAVLink's low-level details. It replaces the deprecated DroneKit library. |
| Flight scripts | Scripts that call mavctl-python to define flight parameters (position, altitude, velocity, etc.) and maneuvers. |
Most autopilot work involves either developing mavctl-python itself or
writing flight scripts with it. You should rarely need to use PyMAVLink
directly, and DroneKit should not be used for new work.
For a list of available MAVLink messages, see the MAVLink common message set.
Repositories
- Shepard – the main repository for
flight-related code.
src/flight_tests– existing flight scripts, which are good examples to learn from.src/modules/autopilot– autopilot modules.navigator.pycontains most of the navigation methods used by flight scripts.
- mavctl-python – the autopilot control library. Development is ongoing; open tasks are tracked on the project board. New members should start with issues labelled "Good First Issue".
Getting Started
- Make sure you are familiar with Python, Git and GitHub (see Required Tools).
- Clone the repository you want to work on.
- Test your code with the Autopilot Simulator.
A good first exercise is writing a simple flight script of your own and running it in the simulator.
If you have any questions, feel free to reach out to the Software team.
Setting Up The Simulator
This guide will go through how to set up the simulator to simulate Autopilot scripts or MavLink connections!
System Requirements:
OS: Ubuntu 22.04+ (Or equivalent to it, WSL will also work, please note that some functionality in WSL is limited)
Create Working Environment for your simulator
It is recommended to enclose your simulator in its own directory for ease of use.
Installing QGroundControl
After installing QGC (QGroundControl): Go to application settings, and then network settings. Add a connection via UDP and make the address 127.0.0.1:14551 and the connection port to be 14551
Set up ArduCopter SITL
Set up the build environment for ArduPilot
ubuntu
Install required packages:
sudo apt-get update
sudo apt-get install git
sudo apt-get install gitk git-gui
mac
install required packages
-
Install Xcode command line tools and homebrew (both likely already done)
xcode-select --install /usr/bin/ruby -e "$(curl -fsSL https://raw.githubusercontent.com/Homebrew/install/master/install)" -
Install required packages
brew update brew install genromfs brew install gcc-arm-none-eabi -
Install the latest version of gawk
brew install gawk -
Install pip (again, likely already done)
python -m ensurepip --upgrade
Clone ArduPilot repository into the simulator directory
git clone --recurse-submodules git@github.com:ArduPilot/ardupilot.git
cd ardupilot
Install the required packages for SITL (Software In The Loop)
Ubuntu
Tools/environment_install/install-prereqs-ubuntu.sh -y
Mac
Tools/environment_install/install-prereqs-mac.sh
NOTE: This installation can be quite lengthy, don't exit out just because its taking too long. Patience is a wonderful thing
Reload the path in order to make these changes take effect. Personally, I'd recommend rebooting your system.
sudo reboot
After your system has finished rebooting:
Build the code and configure it for ArduCopter
./waf configure
./waf copter
./waf clean
At this point, you can test if everything is working by running. You most likely will need to reload the path for this to work (open a new terminal window)
sim_vehicle.py -v Copter
mavproxy.py
If there are no errors, then everything is working. If there are issues, please report them so we can investigate further.
Getting the Scripts to run the simulator
For ease of use, I have created shell scripts that you can run to make things easier
For those of you who are unfamiliar, a shell script is basically a script you can run which will execute commands as if it were you typing things out in the terminal (with a few exceptions)
You can clone the simulator-scripts repo into your simulator directory and the scripts will be added into the directory
git clone git@github.com:uaarg/simulator-scripts.git
Next you need to make these shell scripts executable
chmod +x ./sitl.sh ./proxy.sh ./camera.sh
Installing Gazebo (3D Simulated Environment for Simulating Imaging Scripts in Flight)
Install Gazebo from binary, following the instructions from here: https://gazebosim.org/docs/harmonic/install/
Follow these instructions for Gazebo Harmonic based on your OS:
https://github.com/ArduPilot/ardupilot_gazebo/blob/main/README.md
Test out if the Gazebo SITL works by running sitl.sh, proxy.sh, and the following:
export GZ_SIM_SYSTEM_PLUGIN_PATH=$HOME/ardupilot_gazebo/build:$GZ_SIM_SYSTEM_PLUGIN_PATH
export GZ_SIM_RESOURCE_PATH=$HOME/ardupilot_gazebo/models:$HOME/ardupilot_gazebo/worlds:$GZ_SIM_RESOURCE_PATH
NOTE: If someone could find a way to properly implement this in a shell script that would be goated
gz sim -v4 -r iris_runway.sdf
and in the proxy.sh window, run the following:
mode guided
arm throttle
takeoff 5
If everything works, the drone in the gazebo simulator will take off
Imaging Simulation
Go to Application Settings -> Video in QGroundControl and select UDP h.264 Video Stream and set the UDP URL to '127.0.0.1:5600'
Then run the following
export GZ_SIM_SYSTEM_PLUGIN_PATH=$HOME/ardupilot_gazebo/build:$GZ_SIM_SYSTEM_PLUGIN_PATH
export GZ_SIM_RESOURCE_PATH=$HOME/ardupilot_gazebo/models:$HOME/ardupilot_gazebo/worlds:$GZ_SIM_RESOURCE_PATH
gz sim -v4 -r iris_runway.sdf
And in a seperate terminal window run:
gz topic -t /world/iris_runway/model/iris_with_gimbal/model/gimbal/link/pitch_link/sensor/camera/image/enable_streaming -m gz.msgs.Boolean -p "data: 1"
If you change what world you are running or the model that contains the camera topic then you must change the topic to be whatever new topic you have
If everything works, you'll be able to see a video stream in your QGroundControl Window
Running the Simulator
Open up 4 terminals
- In the first terminal, run
./camera.shif doing Gazebo Simulations - In the second terminal, run
./proxy.sh - In the third terminal, run Gazebo via gz sim -v4 -r
- (Optional) run QGroundControl
If you are running Gazebo, see the instructions to run gazebo in the installing gazebo instructions
The fourth terminal will serve as the place for you to run your python scripts.
To run a python script, navigate to the root of the directory with the script. For example, navigate to the root of shepard (or whatever directory you have your scripts in) and then you can run your scripts as follows:
PYTHONPATH=. python3 <path to your script>
After the script is running, you will know if it is running if there is a print statement in your console saying that the connection has been established
To start flying the drone in the simulator, you will need to go into QGroundControl, set the mode to Guided and then arm the drone and it will
start flying.
Intro to Firmware
Firmware is the software that runs directly on a microcontroller. At UAARG we write firmware for STM32 microcontrollers, a family of ARM Cortex-M chips made by STMicroelectronics.
Firmware is very low level, and involves interfacing directly with hardware.
This guide goes through things you should be familiar with, how to set up a firmware development environment, and the typical workflow for developing firmware.
Prerequisites
C Programming
Almost all STM32 firmware is written in C. You don't need to be an expert, but you should be comfortable with:
- Basic syntax: variables, functions, control flow, arrays and structs
- Fixed-width integer types:
uint8_t,uint16_t,uint32_t, etc. from<stdint.h> - Header and source files: how
.hand.cfiles fit together, and how#includeand#definework
Good resources for learning C:
- Beej's Guide to C Programming (free)
- The C Programming Language by Kernighan and Ritchie ("K&R")
Embedded Systems Basics
You should also have a basic understanding of how microcontrollers work:
- GPIO: configuring pins as inputs or outputs
- Clocks: the microcontroller and each peripheral run off a clock, and peripherals usually have to be enabled before they can be used
- Interrupts: how hardware events pause normal execution to run a handler
- Communication protocols: UART, I2C, SPI and CAN at a high level
You will also need to be able to understand PCB Schematics and Datasheets. These will be the documents which will allow you to understand the hardware which you are writing firmware for. If you are ever confused about a schematic or a datasheet, don't hesitiate to ask the PCB designer or an electrical lead for clarification.
Basic electronics knowledge (voltage, current, pull-up resistors, and using a multimeter) also helps a lot when debugging.
Development Environment
The recommended setup is STM32CubeIDE, ST's free all-in-one IDE. It includes:
- STM32CubeMX, a graphical tool for configuring pins, clocks and peripherals, which generates the setup code for you
- The ARM GCC compiler (
arm-none-eabi-gcc) - A debugger that connects to the board through an ST-Link
You will need an STM32 board and a debug probe to flash and debug it. We use:
- ST Nucleo development boards, which have an ST-Link debug probe built in, so only a USB cable is needed. These are the best place to start.
- Pico debug probes (the Raspberry Pi Debug Probe, or a Pico running the
debugprobefirmware) for our custom hardware. These are used through OpenOCD.
Windows
- Download STM32CubeIDE for Windows from the ST website. You will need to create a free ST account.
- Run the installer and keep the default options. When asked, allow it to install the ST-Link drivers.
- Plug in your board. It should appear in Device Manager as an ST-Link debug probe, along with a "Virtual COM Port" for serial output.
- Install a serial terminal for viewing output from the board, such as PuTTY. STM32CubeIDE also has a built-in serial console.
Linux
These instructions are for Ubuntu 22.04+ (or similar).
-
Download STM32CubeIDE for Linux from the ST website. Pick the Debian/Ubuntu package.
-
Unzip the download and run the installer:
chmod +x st-stm32cubeide_*.sh
sudo ./st-stm32cubeide_*.sh
Accept the licence agreements, and accept when asked to install the ST-Link udev rules. These let you access the board without
sudo. -
Add your user to the
dialoutgroup so you can open serial ports, then log out and back in:sudo usermod -aG dialout $USER -
Plug in your board and check that it is detected:
lsusb | grep -i st-link -
Install a serial terminal for viewing output from the board:
sudo apt install minicom
minicom -D /dev/ttyACM0 -b 115200
Command-Line Toolchain (Optional)
If you prefer working in your own editor (e.g. VSCode), you can install the command-line tools instead of, or as well as, STM32CubeIDE. You will still want STM32CubeMX to generate the project configuration.
-
Windows: install STM32CubeCLT, which bundles the compiler, debugger and flashing tools.
-
Linux:
sudo apt install gcc-arm-none-eabi gdb-multiarch cmake make openocd stlink-tools
ST also publishes an official STM32 extension for VSCode that works with these tools.
For more detail, see Building and Flashing with OpenOCD and Debugging with STM32CubeCLT.
Verifying Your Setup
The classic first program is "blinky":
-
In STM32CubeIDE, go to File → New → STM32 Project and select your board (e.g. your Nucleo model) in the Board Selector tab.
-
Accept the default peripheral configuration. On most Nucleo boards, this sets up the onboard LED pin as a GPIO output.
-
In
main.c, inside thewhile (1)loop, add:/* USER CODE BEGIN 3 */ HAL_GPIO_TogglePin(LD2_GPIO_Port, LD2_Pin); HAL_Delay(500); /* USER CODE END 3 */The LED name (
LD2here) depends on your board. Check the pin labels in the.iocfile. -
Click Run (or Debug) to build the project and flash it to the board.
If the LED blinks, your environment is working.
Development Workflow
A typical firmware workflow looks like this:
- Configure the hardware. Open the project's
.iocfile in STM32CubeMX and set up the pins, clocks and peripherals you need. This is determined from the PCB schematic. - Generate code. CubeMX generates initialization code using ST's HAL (Hardware Abstraction Layer) library.
- Write your code. Only write code between
/* USER CODE BEGIN */and/* USER CODE END */comments in generated files. Anything outside these blocks is overwritten every time code is regenerated. Larger features should go in their own.c/.hfiles. - Build. Compile the project and fix any errors or warnings.
- Flash. Upload the firmware to the board through the ST-Link.
- Debug. Use the debugger to set breakpoints, step through code and watch variables live. Printing over UART to a serial terminal is also useful for checking what the firmware is doing.
If you get stuck, ask the Software or Electrical leads.
Building and Flashing with OpenOCD
OpenOCD (Open On-Chip Debugger) is an open-source tool for flashing and debugging microcontrollers through a debug probe. It lets you build and flash STM32 firmware from the command line, without STM32CubeIDE.
These instructions are for Linux (Ubuntu 22.04+ or similar). This page assumes you have an STM32CubeMX project. See Intro to Firmware for the basics.
Debug Probes
We use two kinds of debug probe:
| Probe | Used for | OpenOCD interface file |
|---|---|---|
| ST-Link (built into Nucleo boards) | Nucleo development boards | interface/stlink.cfg |
Pico debug probe (Raspberry Pi Debug Probe, or a Pico running the debugprobe firmware) | Our custom hardware | interface/cmsis-dap.cfg |
ST-Link (Nucleo)
The ST-Link is built into the Nucleo board, so just connect the board to your computer with a USB cable.
Pico Debug Probe (Custom Hardware)
The Pico debug probe connects to the board's SWD pins:
| Signal | Raspberry Pi Debug Probe ("D" port) | Pico with debugprobe firmware |
|---|---|---|
| SWCLK | Orange (SC) | GP2 |
| SWDIO | Yellow (SD) | GP3 |
| GND | Black | Any GND pin |
- Wire SWCLK, SWDIO and GND to the matching pins on the board (check the board's schematic for where they are).
- Power the board from its own supply. The probe does not power the board.
- Connect the probe to your computer with a USB cable.
The probe also has a UART connection ("U" port on the Debug Probe, or GP4 (TX)
and GP5 (RX) on a Pico) that you can wire to the board's UART pins for serial
output. It shows up as a serial port such as /dev/ttyACM0.
Installation
Install OpenOCD and the ARM toolchain:
sudo apt install openocd gcc-arm-none-eabi gdb-multiarch cmake ninja-build make
Check the installation:
openocd --version
arm-none-eabi-gcc --version
NOTE: The Pico debug probe needs OpenOCD 0.12 or newer. Ubuntu 22.04 ships with 0.11, so if
openocd --versionshows an older version, download the latest Linux release of xPack OpenOCD instead, extract it (e.g. to~/tools/openocd), and add itsbinfolder to yourPATH.
Configuring OpenOCD
OpenOCD needs two configuration files:
- An interface file for the debug probe (see Debug Probes).
- A target file for the microcontroller family, e.g.
target/stm32f4x.cfgfor an STM32F4.
| Chip family | Target file |
|---|---|
| STM32F0 | target/stm32f0x.cfg |
| STM32F1 | target/stm32f1x.cfg |
| STM32F3 | target/stm32f3x.cfg |
| STM32F4 | target/stm32f4x.cfg |
| STM32F7 | target/stm32f7x.cfg |
| STM32G4 | target/stm32g4x.cfg |
| STM32H7 | target/stm32h7x.cfg |
| STM32L4 | target/stm32l4x.cfg |
The full list is in /usr/share/openocd/scripts/target (or
scripts/target in the xPack download).
Project Configuration File
Create a file called openocd.cfg in the root of your project. When you run
openocd with no -f options, it automatically uses this file from the
current directory. Use the version for your probe, with your chip's target
file.
ST-Link (Nucleo):
source [find interface/stlink.cfg]
source [find target/stm32f4x.cfg]
Pico debug probe:
source [find interface/cmsis-dap.cfg]
transport select swd
adapter speed 5000
source [find target/stm32f4x.cfg]
If you use both (e.g. Nucleo for development, then custom hardware), keep two
files, such as openocd-nucleo.cfg and openocd-probe.cfg, and pick one with
-f:
openocd -f openocd-probe.cfg
Commit these files so everyone on the project uses the same configuration.
Testing the Connection
With the board connected and powered, run:
openocd
(or openocd -f <your config file>). If it connects, OpenOCD prints
information about the chip and waits for a debugger. Press Ctrl+C to stop
it.
Building
To build from the command line, STM32CubeMX must generate a CMake or Makefile project instead of an STM32CubeIDE project.
- Open the project's
.iocfile in STM32CubeMX. - In the Project Manager tab, set Toolchain / IDE to CMake (or Makefile).
- Click Generate Code.
CMake
From the root of the project:
cmake --preset Debug
cmake --build --preset Debug
The firmware is built to build/Debug/<project name>.elf. Use the Release
preset for an optimized build.
Makefile
From the root of the project:
make -j
The firmware is built to build/<project name>.elf.
Flashing
To flash the firmware, verify it, and reset the board to start running it:
openocd -c "program build/Debug/<project name>.elf verify reset exit"
This uses the openocd.cfg file in your project. To use a different config
file, add -f <config file> before -c.
TIP: Combine building and flashing into one command so you don't forget to rebuild:
cmake --build --preset Debug && openocd -c "program build/Debug/<project name>.elf verify reset exit"
Debugging
OpenOCD can also act as a GDB server. This is how to debug with the Pico debug probe, since ST's debugging tools only support ST-Links. Start OpenOCD with no commands:
openocd
Then, in a second terminal, connect GDB on port 3333:
gdb-multiarch build/Debug/<project name>.elf
(gdb) target extended-remote localhost:3333
(gdb) monitor reset halt
(gdb) load
Common GDB commands are covered in Debugging with STM32CubeCLT.
Troubleshooting
| Problem | Things to try |
|---|---|
Error: open failed, LIBUSB_ERROR_ACCESS or unable to find a matching CMSIS-DAP device | OpenOCD can't access the probe. Check the USB cable, and that the probe shows up in lsusb. |
init mode failed (unable to connect to the target) or Error connecting DP | Check the target file matches your chip. For the Pico debug probe, check the SWD wiring and that the board is powered, and try a lower speed (e.g. adapter speed 1000). Holding the board's reset button while OpenOCD starts can also help. |
| Pico debug probe not recognized at all | Check your OpenOCD version is 0.12 or newer. |
unknown device or wrong flash size | You are probably using the wrong target file. |
| Flash succeeds but the code doesn't run | Make sure reset is in the program command, or press the board's reset button. |
| ST-Link firmware warnings | Update the ST-Link firmware using STM32CubeProgrammer. |
Debugging with STM32CubeCLT
STM32CubeCLT (STM32Cube Command Line Tools) is ST's toolset for building, flashing and debugging STM32 firmware from the command line. It contains the same tools STM32CubeIDE uses, without the IDE, so you can use any editor (e.g. VSCode).
This page assumes you have an STM32CubeMX project generated for CMake. See Intro to Firmware for the basics, and Building and Flashing with OpenOCD for how to generate a CMake project.
NOTE: ST's flashing and debugging tools (
STM32_Programmer_CLIandST-LINK_gdbserver) only work with ST-Links, such as the one built into Nucleo boards. To flash or debug our custom hardware with a Pico debug probe, use OpenOCD instead. You can still use CubeCLT's compiler and GDB with it, and everything in Debugging with GDB from step 2 onwards applies; just connect to OpenOCD's port (target extended-remote localhost:3333) instead oflocalhost:61234.
What's Included
| Tool | Command | Purpose |
|---|---|---|
| GNU Tools for STM32 | arm-none-eabi-gcc, arm-none-eabi-gdb | Compiler and debugger |
| ST-Link GDB server | ST-LINK_gdbserver | Connects GDB to the board through an ST-Link |
| STM32CubeProgrammer | STM32_Programmer_CLI | Flashes, erases and reads the chip |
| CMake and Ninja | cmake, ninja | Build tools |
| SVD files | – | Describe every peripheral register, so debuggers can show them by name |
Installation
Windows
- Download STM32CubeCLT for Windows from the ST website. You will need a free ST account.
- Run the installer and keep the default options, including the ST-Link
drivers. It installs to
C:\ST\STM32CubeCLT_<version>\.
Linux
-
Download STM32CubeCLT for Linux (the Debian/Ubuntu package) from the ST website.
-
Unzip the download and run the installer:
chmod +x st-stm32cubeclt_*.sh
sudo ./st-stm32cubeclt_*.sh
Accept the licence agreements and the ST-Link udev rules. It installs to
/opt/st/stm32cubeclt_<version>/.
Adding the Tools to Your PATH
If the commands below aren't found, add these folders (inside the install
folder) to your PATH:
GNU-tools-for-STM32/binSTLink-gdb-server/binSTM32CubeProgrammer/binCMake/binandNinja/bin
On Linux, for example, add this to your ~/.bashrc (with your version number):
export CLT=/opt/st/stm32cubeclt_<version>
export PATH=$CLT/GNU-tools-for-STM32/bin:$CLT/STLink-gdb-server/bin:$CLT/STM32CubeProgrammer/bin:$CLT/CMake/bin:$CLT/Ninja/bin:$PATH
Check the installation by opening a new terminal and running:
arm-none-eabi-gcc --version
STM32_Programmer_CLI --version
Building for Debugging
Always debug a Debug build. Release builds are optimized, which reorders and removes code, so stepping through it and inspecting variables becomes unreliable.
cmake --preset Debug
cmake --build --preset Debug
The firmware is built to build/Debug/<project name>.elf.
Flashing
To flash the firmware, verify it, and reset the board:
STM32_Programmer_CLI -c port=SWD -w build/Debug/<project name>.elf -v -rst
-c port=SWDconnects through the ST-Link using SWD-wwrites the file to flash-vverifies the write-rstresets the board so the new firmware starts running
Debugging with GDB
Debugging needs two terminals: one running the GDB server, which talks to the board, and one running GDB, which you type commands into.
1. Start the GDB Server
ST-LINK_gdbserver -p 61234 -d -e -cp <CubeCLT install folder>/STM32CubeProgrammer/bin
-p 61234is the port GDB connects to-duses the SWD debug interface-ekeeps the server running after GDB disconnects-cpis the path to STM32CubeProgrammer, which the server needs to flash the chip
Leave this terminal open.
2. Connect GDB
In a second terminal, from the root of your project:
arm-none-eabi-gdb build/Debug/<project name>.elf
Then, at the (gdb) prompt:
target remote localhost:61234
load
monitor reset
break main
continue
This connects to the board, flashes the firmware, resets the chip, sets a
breakpoint at main, and runs until it is reached.
Common GDB Commands
| Command | Short form | Description |
|---|---|---|
break <function or file:line> | b | Set a breakpoint, e.g. b main.c:120 |
info breakpoints | i b | List breakpoints |
delete <number> | d | Remove a breakpoint |
continue | c | Run until the next breakpoint |
next | n | Run the next line, stepping over function calls |
step | s | Run the next line, stepping into function calls |
finish | Run until the current function returns | |
Ctrl+C | Pause the running program | |
print <expression> | p | Print a variable or expression, e.g. p sensor.value |
display <expression> | Print an expression every time the program stops | |
watch <variable> | Stop whenever a variable changes | |
backtrace | bt | Show the chain of function calls that led here |
info registers | i r | Show CPU registers |
x/<n>xw <address> | Show n words of memory in hex, e.g. x/4xw 0x40020000 | |
monitor reset | Reset the chip | |
load | Flash the current .elf file again | |
quit | q | Exit GDB |
After changing your code, rebuild in another terminal, then run load and
monitor reset in GDB. There's no need to restart GDB or the server.
Debugging a HardFault
If the firmware crashes, it usually ends up stuck in HardFault_Handler (in
stm32xxxx_it.c). To find out why:
-
Set a breakpoint on the handler before running:
break HardFault_Handler -
When it stops there, run
backtraceto see which function caused it. -
Check the fault status register to see what kind of fault it was:
x/wx 0xE000ED28Look up the bits of this register (the CFSR) in the ARM Cortex-M documentation. Common causes are dereferencing a null or invalid pointer, a stack overflow, and dividing by zero.
Using VSCode
Typing GDB commands works anywhere, but a graphical debugger is often easier. In VSCode, you can use either of these extensions:
- STM32 VS Code Extension (official, from ST), which uses STM32CubeCLT directly and can import STM32CubeMX CMake projects.
- Cortex-Debug, a general debugger for ARM microcontrollers. Set its
servertypetostlink(oropenocd). Point itssvdFilesetting at your chip's SVD file from the CubeCLT install to view peripheral registers by name.
Both give you breakpoints, stepping, variable watches and register views from inside the editor.